The Basics
Back in 2015 i started to monitor my house. It starts with collecting data from several sources.
Lets start with my netatmo weather station. It consists of the RainGauge, Wind Sensor, Outdoor Module and several indoor Modules. Goal was to display the data not only in the netatmo app, i wanted to have some fancy grafana dashboards. For this i collect the data on two different ways.
1.) python app
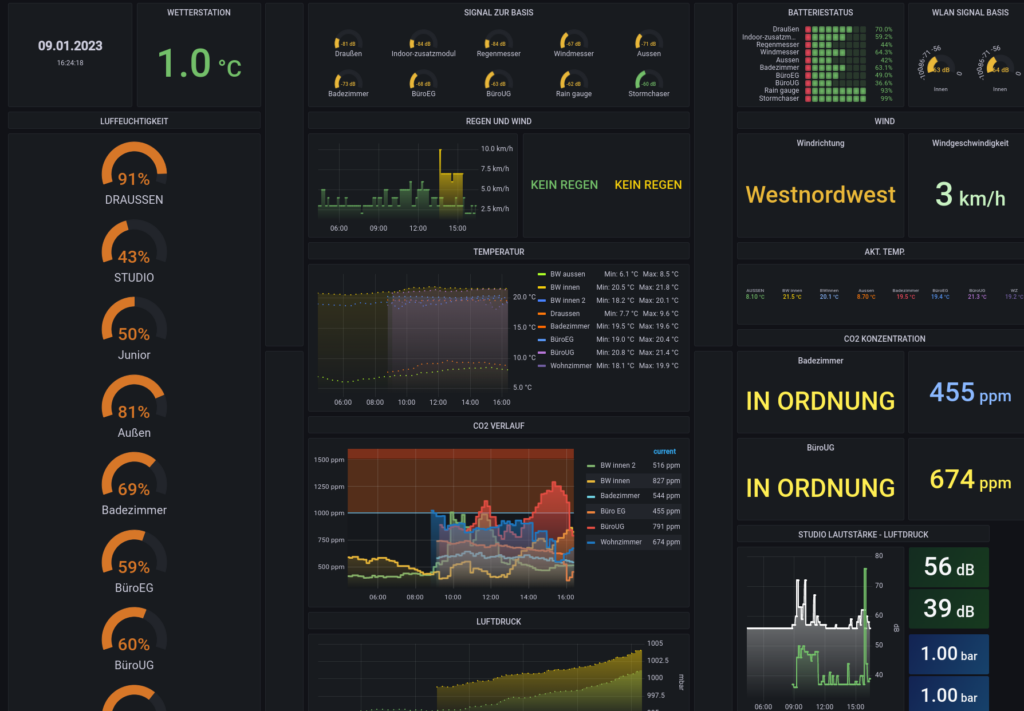
with a small python script ( https://github.com/philippelt/netatmo-api-python ) i collect the data from the netatmo devices every 5 minutes ( easy via crontab) . These data are stored in the main influxdb instance netatmo, and dispaly in this dashboard
You can find the dashboard at grafana.com ( ID = 1234)
2.) prometheus collector
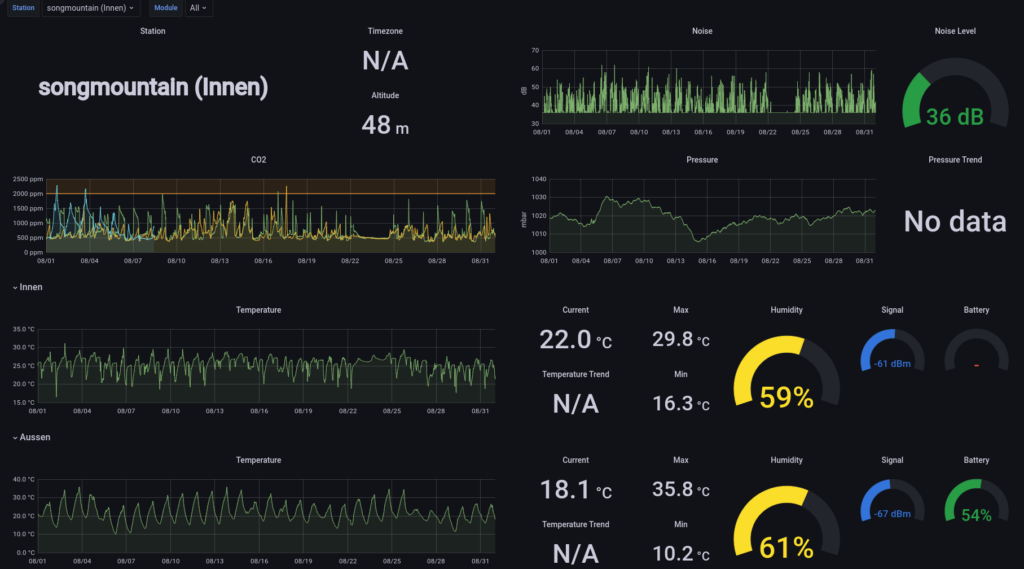
I found a new dashboard on grafana.com ( ID = 2345 ), but this dashboard relied on prometheus data source in grafana. So i hooked up a prometheus collector for netatmo data ( https://github.com/xperimental/netatmo-exporter/tree/new-auth ). Ensure to use the branch new-auth, because netatmo changed the way how to authenticate against their API.
Next create the data source:
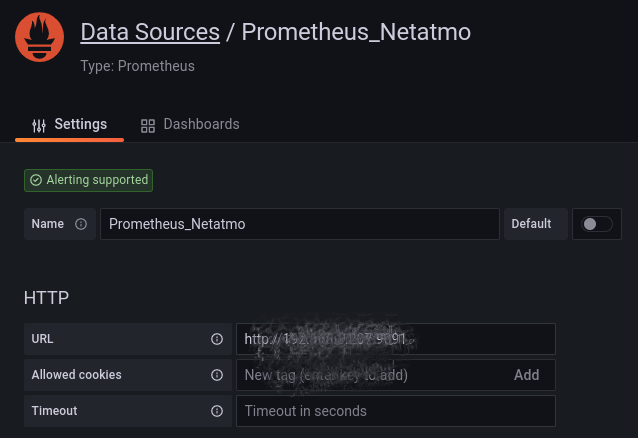
and then import the dashboard